我的 OpenCode 桌面后台服务(SEA 单文件打包的 Node 进程)内存涨到了 1.1 GiB。我把整个排查和修复交给了 Codex,前后一共做了四轮工作:先定位并修复一个藏在 Node ESM 缓存里的插件模块泄漏,再追查第二个进程的"高内存",最后发现那其实不是泄漏,而是打包方式导致的巨大基线,于是又做了一轮瘦身,把启动内存从 500 MiB 压到 177 MiB。四天后(9 月 18 日)又用瘦身后的 v2.0.5 做了第五、六轮复查:大泄漏没有复发,但逮到一个 gray-matter 默认缓存造成的小泄漏,顺手修掉并把打包的 Node 从 26.8.1 升到 26.8.2。
这篇文章按时间顺序记录完整的操作过程,重点是把每一步用了什么命令、看到什么、下一步怎么判断写清楚。
第一轮:排查 PID 57305(1.1 GiB)
先看进程的内存构成
目标进程是 opencode2-v2.0.3 serve --service,已运行 4 小时。第一步永远是无侵入的测量:
|
ps 显示 RSS 约 1.16 GiB;vmmap -summary 显示物理足迹 1.1 GiB(峰值 1.8 GiB),其中绝大部分可写内存落在 V8 堆区域(macOS 上标记为 Memory Tag 255,驻留 832 MiB),而 SEA 镜像本身只占 26.4 MiB 只读。结论:大头在 V8 堆里,值得抓堆快照。
用 SIGUSR1 触发堆快照
这个版本的 OpenCode CLI 内置了一个诊断开关(packages/cli/src/heap.ts):收到 SIGUSR1 就往日志目录写一份 .heapsnapshot。这意味着不需要附加调试器、不需要 sudo:
|
约 4.7 秒后得到一份 474 MB 的快照文件(382 万个节点、2462 万条边)。注意一个坑:抓快照本身很耗内存,进程 RSS 临时涨到了约 2.1 GiB。所以诊断期间的内存读数不能当作进程"正常"的证据。
自写脚本分析堆快照
.heapsnapshot 是 JSON,但 474 MB 的文件没法直接打开看。Codex 写了两个 Node 脚本:analyze.mjs 负责解析格式、按类型分组统计并构建支配树(dominator tree),inspect.mjs 用来交互式查询"谁持有谁":
|
支配树分析立刻给出了方向:ModuleLoader → LoadCache 这一条链保留了 208 MiB。继续查模块 URL 的重复度,发现了决定性的异常:
- 同一个本地插件入口
thape-tools.ts出现了 56 次,每个副本的 URL 带不同的?__opencode_reload=N查询参数; - 它的 14 个本地依赖文件也各自出现 56 次——15 个物理文件对应 840 个模块加载任务;
- 随之保留的还有 448 份工具定义对象(含 Zod schema 图),共 130 MiB。
保留路径也很清楚:
|
用日志还原时间线
为什么同一个文件会被加载 56 次?从 opencode.log 里按 run id 过滤,统计插件加载和 Location 驱逐事件:
|
时间线是:17:08 加载 28 个 Location 的插件 → 18:17 驱逐 28 个、随即重新加载 28 个 → 19:50 再次驱逐 28 个;而 21:11 抓的快照里,56 代模块全部还在。
这条日志很关键:它说明 OpenCode 的清理逻辑正常运行了(Location 空闲 60 分钟会被驱逐),但 Node 的模块缓存没有跟着释放。
定位到代码
读 packages/plugin/src/source.node.ts 就看到了问题:每次创建插件加载器实例,都会递增一个进程级计数器并拼进 import URL,用查询参数做"缓存穿透"来支持热重载:
|
而 Node 的 ESM 缓存按完整 URL(含 query)区分模块,且不像 require.cache 那样可以删除。于是生命周期错配出现了:
| 资源 | 生命周期 |
|---|---|
| 源文件指纹、import 记忆 | 一个 Location |
| 插件激活、文件监听 | 一个 Location |
| 已求值的 ESM 模块 | 被 Node 运行时永久持有 |
Location 被驱逐时,前两行都清理干净了;新 Location 重建时指纹缓存是空的,认不出"文件内容没变",就用新 URL 再 import 一遍——老的那一代模块永远留在堆里。一句话总结:OpenCode 忘了自己可以复用模块,Node 却记住了每一代模块。
独立复现,排除 SEA 的嫌疑
为了证明这和 SEA 打包无关,用仓库里真实的加载器代码做最小复现。先把 packages/plugin/src/source.ts 打包成单个 Node 模块:
|
再写一个复现脚本 /tmp/opencode-esm-repro/repro.mjs:造一个导出 10 万元素数组的假插件,循环 40 次"创建加载器 → 读取 → dispose",每 10 轮让出事件循环并强制两次 GC 后采样 heapUsed。支持两种模式:recreated(每轮重建加载器,模拟 Location 驱逐重建)和 shared(复用一个加载器,对照组):
|
结果:recreated 组堆从 4.39 MiB 线性涨到 35.57 MiB,shared 组始终稳定在 5.4 MiB。普通 Node 26.8.2 即可复现,泄漏机制坐实。
第二轮:修复插件加载器
修复的核心思路是把两条生命周期拆开:模块求值结果提升为进程级缓存,插件激活和 watcher 仍按 Location 管理。
具体改动在 packages/plugin/src/source.ts:
sourcesMap 从createPluginSources()闭包内(Location 作用域)提升为模块级全局;- 读取时先比对文件指纹,没变就复用已求值的模块;并发读取 join 同一次 import;
- 失败的求值也缓存,避免坏模块每次通知都重复执行副作用;
- 每个新 Location 仍然订阅已知依赖的 watcher;dispose 时只摘除自己的 listener,防止缓存反过来持有已关闭的 Location;
- 被取代的旧模块图在没有监听者后才释放 resolver hook。
验证分三层:
|
中间踩了个小坑:macOS 上 /var 是 /private/var 的符号链接,导致几个测试的临时路径断言假失败,给 fixture 套上 realpath() 即可。
内存对比用第一轮同款的复现脚本,分别从修复前后的 commit 构建加载器各跑一遍:
|
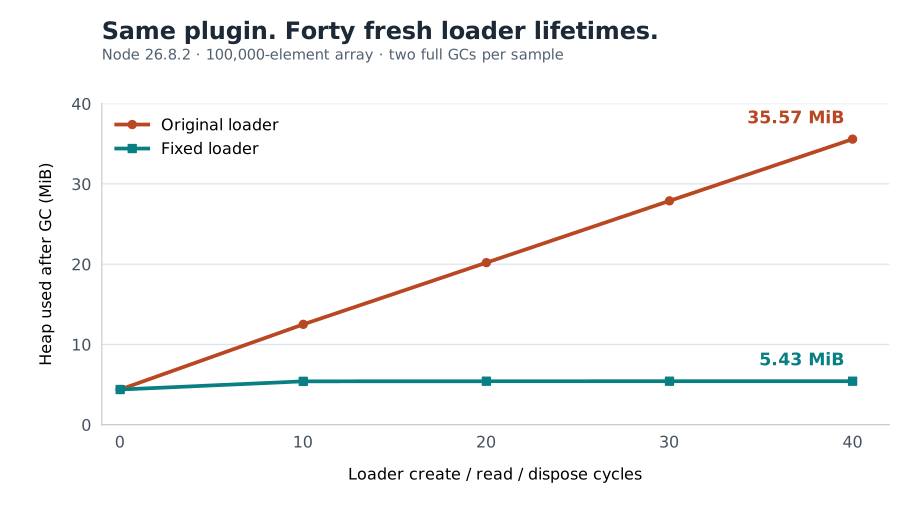
修复后 40 轮重建堆完全平坦(35.57 → 5.43 MiB)。45 个 Bun 测试、8 个 Node 回归、28 个 core 生命周期测试、37 个 lint/typecheck 任务全部通过。修复 commit 是 25fdc20a。重启服务后,进程足迹从约 1.1 GiB 降到 493.5 MB。
第三轮:排查 PID 86915(626 MB)——这次不是泄漏
第二天又看到一个同版本服务进程占了 626 MB,直觉是"又是泄漏"。这次的结论却完全不同,过程也值得记录。
开头的套路一样:ps + vmmap -summary 确认规模,kill -USR1 86915 抓堆快照。native 侧用 leaks 扫(普通权限会被 macOS 拒绝,需要 sudo leaks 86915),结果只有约 212 KiB 的泄漏——不足以解释几百 MB。
堆分析显示活跃堆共 291.62 MiB,最大的单一对象是一个 51.68 MiB 的字符串——整个打包后的程序源码。这提示问题可能不在"泄漏",而在"基线"。
关键一步:做基线复现
写一个 Python 脚本,用同一个 SEA 二进制、在完全隔离的环境(独立 XDG/HOME 目录、禁用模型拉取和自动更新)里起一个干净的服务器,分阶段采样内存:
|
脚本逻辑:隔离环境变量 → serve --port 0 启动 → 分阶段(零项目 → 两个空项目 → 3 轮 reload)采样 ps/vmmap(第五轮有这个思路的完整版脚本)。
结果令人意外:空载启动就要 500.2 MiB RSS,加载两个空项目 589.6 MiB,反复 reload 后稳定在约 632 MiB。也就是说 626 MB 里几乎没有"漏"出来的部分——这个进程一出生就这么大。
解剖 SEA 二进制
为确认那 51.68 MiB 的源码字符串来自哪里,直接解剖二进制。Node SEA 把内嵌脚本放在 NODE_SEA 段里:
|
从输出拿到 __NODE_SEA_BLOB 段的 fileoff/filesize 后,用 Python struct 按该偏移把 blob 读出来:SEA blob 是一串带长度前缀的字段(magic、主代码、代码缓存等),顺序解析即可取出主脚本。
提取出的主脚本是 27,298,495 字节 UTF-8,作为 UTF-16 字符串驻留堆中正好 51.68 MiB,SHA-256 也对得上——身份确认。
用强制 GC 排除"持续增长"
最后一个对照实验:把提取出的主脚本用本地 Node 跑起来,注入一个每 2 秒强制 GC 并记录堆用量的探针:
|
heapUsed 升到约 158 MiB 后稳定不动。没有持续增长型泄漏。结论:这个进程的问题是 SEA 打包方式导致的巨大基线——主 bundle 把 TUI、TypeScript 编译器等动态 import 全部内联并提前执行,web 资源归档和模型目录快照又以巨型字符串内嵌在源码里常驻。另外还发现一个小问题:录音结束后 AudioRecorder 会保留一个 16 MiB 的 WebAssembly encoder(只保留最后一次,不累积)。
第四轮:把基线从 500 MiB 压到 177 MiB
拿到"不是泄漏、是基线"的结论后,最后一轮就是照着建议做瘦身。主要改了五处:
- 恢复懒加载边界:Node 构建配置里
inlineDynamicImports: true会把所有动态 import 折叠进一个模块。改为 SEA 引导(只有 6,687 字节)+ 磁盘上的 ESM chunk。这里踩了个坑:SEA 内嵌主脚本里的import()只接受内置模块,直接import(file://...)会报ERR_UNKNOWN_BUILTIN_MODULE,解法是写一个load.cjs桥接文件,用require()绕回 Node 正常的 ESM 加载器。 - 大 payload 资产化:web 应用归档(8.4 MiB)和 models.dev 模型快照(7 MiB)从内嵌字符串改为资产文件,按需
readFileSync。 - TypeScript 编译器延迟加载:CodeMode 的编译器挪到首次执行时才
import()。 - 拆开 TUI 配置对 OpenTUI 的依赖:CLI 加载配置 schema 时会经由 keybind helper 拖入整个 OpenTUI。用构建期导出的模块图 + BFS 找到这条路径后,把纯 schema 声明拆到独立的
schema.ts。 - 修录音保留:
bun patch @mixtint/audio-recorder-node给第三方包打补丁,录音完成后释放 session 和 encoder。
为防止回归,还在 vite 配置里加了一个构建期图检查插件:从 server 入口遍历 chunk 图,一旦发现 eager 引入 @opentui/core、typescript 或模型快照文本,直接构建报错。
测量用基线脚本参数化后的版本,对修复前后的二进制各跑一遍:
|
结果(RSS):启动 500.8 → 177.0 MiB(-64.6%),加载两个项目并三轮 reload 后的稳定态 652.6 → 348.2 MiB(-46.6%)。233 个聚焦测试、37 个 lint/typecheck 任务、打包后 web UI 和 TUI 渲染冒烟全部通过。
第五轮(9 月 18 日):复查 v2.0.5——大泄漏没有复发
瘦身后的版本跑了几天,桌面服务进程(opencode2-v2.0.5 serve --service,PID 14076,已运行 7 小时 40 分)在活动监视器里占 383.6 MB。vmmap 物理足迹 373.5 MiB(峰值 452.2 MiB),ps RSS 483.6 MiB——口径不同但量级一致。比 1.1 GiB 时代好了太多,可绝对值仍不算小,这次要回答的问题是:还在漏吗?
双快照差分:最省事的"有没有在漏"判断
判断有没有持续增长,盯一份快照不如隔几分钟抓两份做差分。SIGUSR1 照旧,间隔 2.5 分钟:
|
差值是 +12.5 KiB、−5 个节点——空闲状态下没有持续增长的 JS 泄漏。native 侧 leaks 扫描也只有约 312 KiB(3,150 处可疑分配),同样解释不了几百 MB。
堆里装的是工作集,不是垃圾
用第一轮同类的支配树脚本看构成:字符串 38.2 MiB、代码 32.7、对象 32.0、数组 20.3、闭包 17.3、其他 18.4。主要来源都很"正当":
- bundle 里 execute / process 两个 chunk 的源码字符串就有 7.2 + 3.6 MiB(还没算编译产物和对象);
- 完整 TypeScript 编译器(codemode 的 transpiler 静态 import 了它),外加 Node 自带的 Amaro TS loader(3.6 MiB 源码 + 3.75 MiB WASM buffer);
- THAPE 插件从自己的
node_modules里加载了第二份 Effect——303 个依赖文件、6.8 MiB 源码字符串; - MCP/Zod schema、Effect 服务、模型目录等常驻。
这些是加载进来的工作集,不是漏出来的垃圾。另外从快照里的 process 对象还读出一个意外信息:二进制内嵌的运行时是 Node 26.8.1(V8 14.6.202.34-node.28)。文件名里的 v2.0.5 是应用版本(API 自报 0.0.0-dev-202609171702),不代表内嵌运行时。
隔离环境的生命周期实验
第三轮"基线复现"的手法再升级:用同一个二进制在完全隔离的环境起服务(不碰正在运行的进程),这次直接通过 HTTP API 加载/驱逐空项目,每个阶段用 SIGUSR1 抓一次快照:
|
|
| 阶段 | 快照计入的存活堆 |
|---|---|
| 启动,无项目 | 47.47 MiB |
| 加载 1 个项目 | 67.77 MiB |
| 加载 6 个项目 | 87.37 MiB |
| 驱逐其中 5 个 | 72.03 MiB |
| 再重复 3 轮加载/驱逐 | 72.94 MiB |
第一次驱逐确实把项目对象释放掉了:和单项目快照相比多出来的 4.26 MiB 里,4.00 MiB 是编译后的代码;之后又跑了 3 轮加载/驱逐,只多出约 18 KiB 对象,节点总数还在下降。第二轮修的 Location 驱逐是真的生效了。(干净实例抓快照前的空载物理足迹是 130.4 MiB。)
唯一逮到的真问题:gray-matter 的全局缓存
支配树分析里有一个虽小但扎眼的东西:matter.cache 持有 39 条缓存、约 1.2 MiB。读 gray-matter 4.0.3 的源码发现:不传 options 时,它把完整输入文本当 key 写进进程全局缓存 matter.cache,没有任何淘汰。而 ConfigMarkdown.parse 是配置、agent 定义、规则文件的统一解析入口——每编辑一次产生一个新修订版,全文 key 就永远多一份。
复现只需要几行(在 packages/core 目录下跑,直接用真实实现):
|
| 操作 | 缓存条目 | 缓存 key 字节 |
|---|---|---|
| 初始 | 0 | 0 |
| 同一 16 KiB 文档解析 200 次 | 1 | 16,407 |
| 200 个不同修订版 | 201 | 3,298,097 |
| 显式 clearCache 后 | 0 | 0 |
机制坐实:不是每次读取都漏,而是每个不同版本都留一份,且无界。1.2 MiB 虽小,但架不住天天编辑配置和 agent 文件地累积。
第六轮:修复 gray-matter 缓存,顺手升级 Node 26.8.2
修复小到不好意思——给两条解析路径都传一个空 options:
|
传任意 options 就会绕过缓存,gray-matter 源码里的注释写得很坦白:only cache if there are no options passed。
回归测试加在 packages/core/test/config/markdown.test.ts:200 个互不相同的 16 KiB 文档(分别覆盖正常和需要 sanitize 的 frontmatter)解析后,matter.cache 条目数保持不变;另有两个用例覆盖重复 sanitize 解析和重复拒绝非法 frontmatter。写测试时还顺带暴露了一个附赠 bug:被缓存的失败解析在重试时可能返回不完整结果,同一个修复一并解决。
顺手把打包运行时的 Node 钉版从 26.8.1 升到 26.8.2——packages/cli/script/build-node.ts 的 NODE_VERSION 加 .github/workflows/test.yml、publish.yml 共 3 处(Codex 原本建议直接上最新的 26.9.0,我选了同 minor 的补丁版本,风险更小)。
验证:209 个 config 测试、bun run check(全仓库 lint + 类型检查)、macOS ARM64 打包构建、隔离环境 service 生命周期冒烟全部通过。修复 commit 是 2dbfa55013。
经验总结
六轮工作下来,有几条方法论最值得记住:
- 先分清"泄漏"还是"基线"。看到大内存先别急着找泄漏:用隔离环境起一个干净进程做基线复现,再看堆是否持续增长。三个进程看似同一种病,实际上一个是真泄漏、两个是高工作集,修法完全不同。
- 清理代码"跑过了"不等于内存释放了。第一轮的教训是:应用层的 dispose 日志一切正常,但强引用链从 GC roots 经过运行时的模块缓存一直通到旧数据。排查时该问的问题是——清理完成之后,还有哪个更长寿的对象够得着这份数据?
- 判断"有没有在漏",双快照差分比单份快照高效。同一进程隔几分钟各抓一份,总量和节点数几乎不动(158.888 → 158.901 MiB,−5 个节点)就可以排除持续增长型泄漏,把精力转向工作集构成。再配合隔离环境的生命周期实验(加载 → 驱逐 → 快照),还能验证清理逻辑是不是真的释放了内存。
- 第三方库的"贴心默认"也是泄漏源。gray-matter 不传 options 就开启以输入全文为 key 的无界全局缓存——这种机制单次只有 KiB 级,但乘以运行天数同样会长大。好在修复成本往往只是一行。
另外一条实用提醒:抓堆快照、反复 vmmap 这类诊断动作本身会把进程内存显著抬高(57305 一度涨到 2.1 GiB;第五轮复查时 14076 的峰值也被推到了约 1.3 GiB,诊断结束时足迹 420.9 MiB,高于未打扰时的 373.5 MiB)。诊断前后的读数不能混用,修完后记得重启进程再测量。